|
First official sunspot belonging to the new Solar Cycle 24


February 17 2008-NASA
and European Space Agency satellite images have captured the appearance of the
first sunspot of the new solar cycle. Sunspots are areas of intense magnetic
activity that are visible on the surface of the Sun as dark spots. Sunspot
activity rises and falls on a roughly 11-year cycle. The previous solar cycle
peaked between 2000 and 2002. Even as scientists kept an eye on the sunspot
“stragglers” of waning Solar Cycle 23 in late 2007, they were also on the
lookout for the first sunspot that would signal the start of Solar Cycle 24.
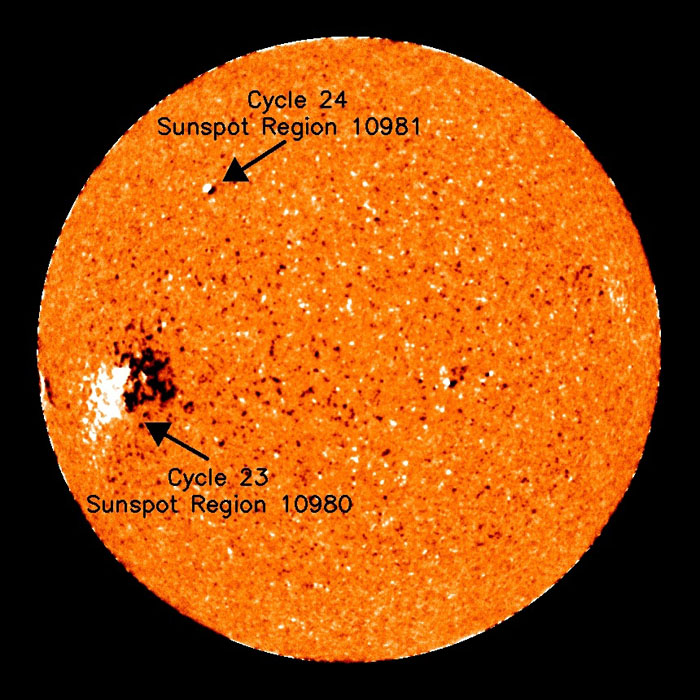
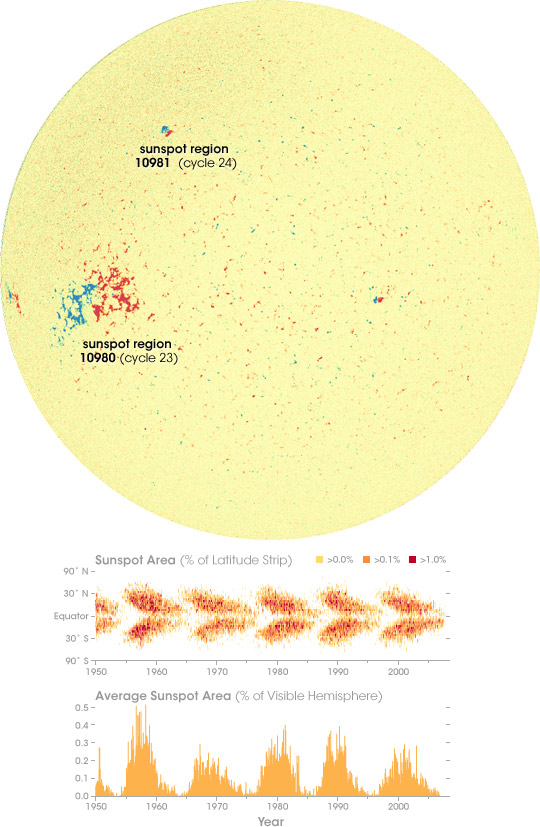
On January 4, 2008, the new sunspot—about the width of the Earth, but small by
Sun standards—appeared in the Sun’s Northern Hemisphere, with its north magnetic
pole (red area) pointing to the right and its south magnetic pole (blue)
pointing to the left. The image was captured by the Solar and Heliospheric
Observatory satellite. The sunspot lasted until January 6 before fading away.
The animations above show activity between January 1-14.
The position of the magnetic poles in sunspot 10981 was one of the ways
scientists knew it was part of a new cycle. Within any particular cycle, the
sunspots in each hemisphere will have opposite polarity, and the polarity for
each hemisphere reverses from cycle to cycle. Since the large sunspot area in
the Southern Hemisphere from Solar Cycle 23 (number 10980, shown in the
left-hand part of the image) is also oriented with its north pole at right and
south pole at left, the new one that appeared in the Northern Hemisphere on
January 4 must be part of a different solar cycle.
The other criteria that let scientists know that spot 10981 was part of a new
cycle was its location on the face of the Sun. The first sunspots of a new solar
cycle always appear in the higher latitudes of both hemispheres. As the cycle
matures, the sunspots get closer and closer to the equator. When scientists
graph the latitude of sunspots over the course of many solar cycles, the result
is a sequence of symmetrical shapes that they refer to as a “butterfly diagram.”
Butterfly diagrams also show how the last sunspots of older cycles occur at the
same time as the first sunspots of new cycles, just as sunspots from Solar
Cycles 23 and 24 overlap in the image.
The area of the Sun affected by sunspots varies from cycle to cycle (final
graph) and depends on the number and size of the spots. Solar Cycle 19 (second
peak from left), which began in 1954 and peaked in 1957, is the record holder
for most active solar cycle, with 201 sunspots. Higher numbers of sunspots make
major solar storms more likely. Solar storms can interfere with power grids,
aircraft navigation and communication systems, and satellites. The panel of
scientists who issue forecasts for the Space Environments Center at the National
Oceanic and Atmospheric Administration was evenly spilt about the prospects for
Solar Cycle 24. About half the panelists thought it would be a moderately strong
cycle, with about 140 sunspots, and the other half thought it would be
moderately weak, with about 90 sunspots.


|


